01
Data and Analytics
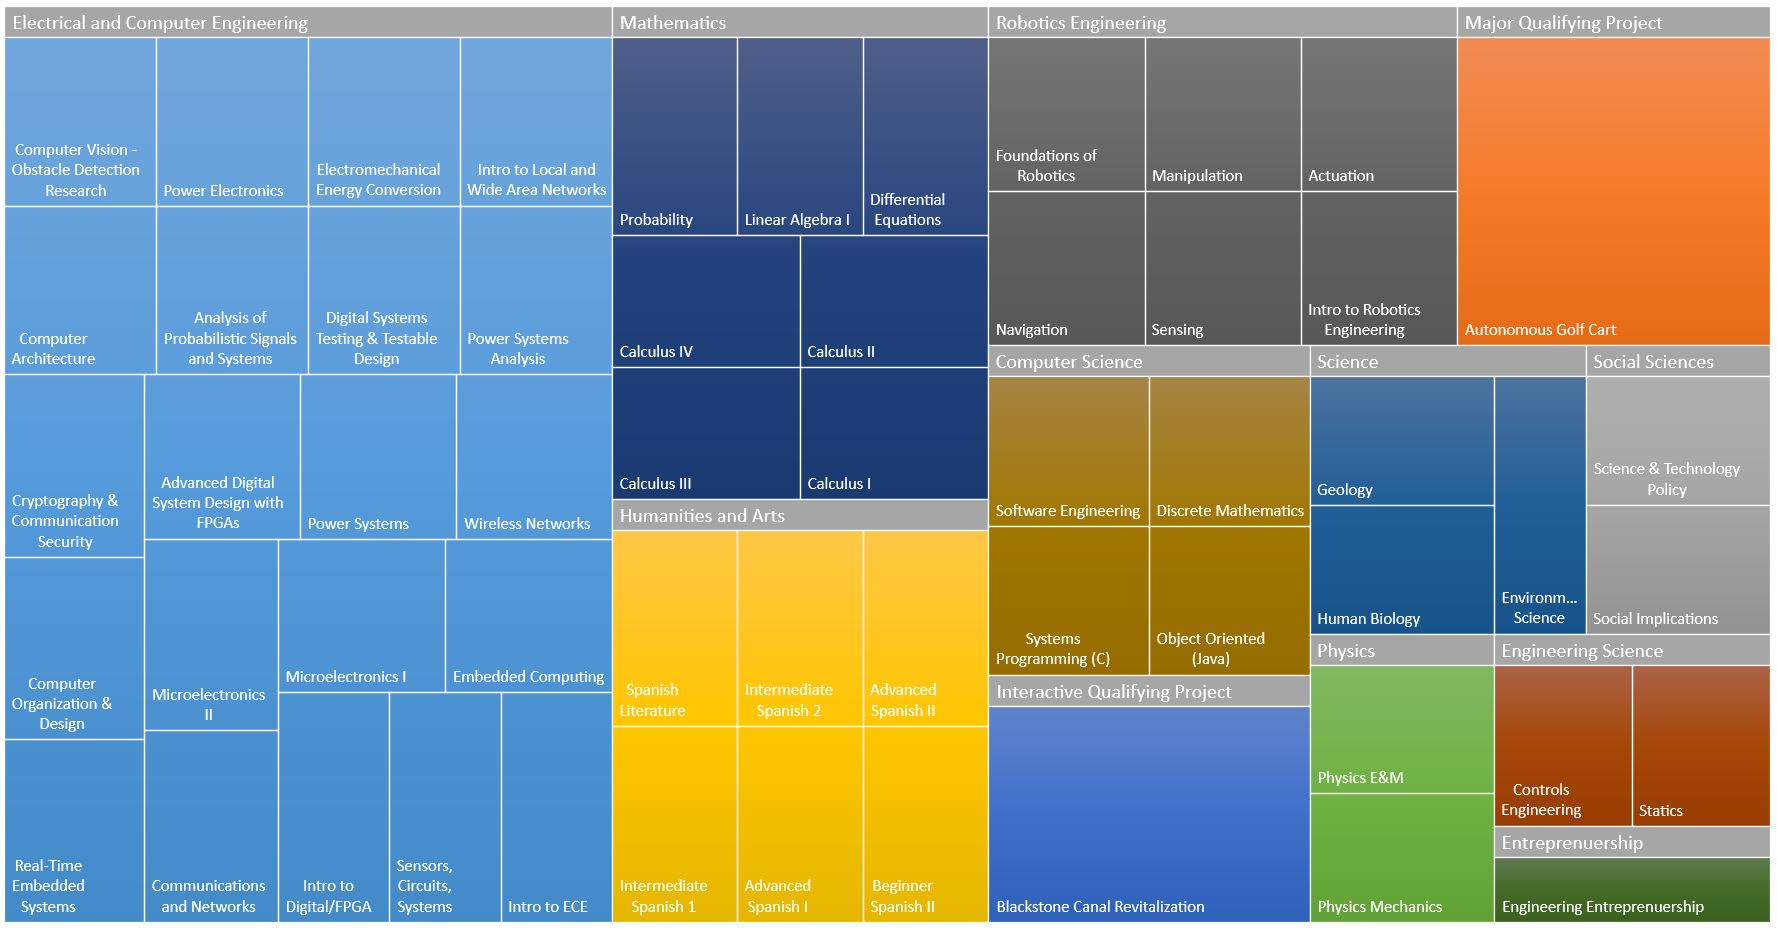
I've produced some tables, charts, and treemaps to display the weight of my academic expertise in each field of study.
Please feel free to click on any of the photos to enlarge them.
02
Treemap
This treemap is an effective way to display a lot of data. My academic classes are shown in different colors sorted by field of study. Within those disciplines, I have boxes representing courses. They are named according to the course title, and sized by the number of academic credits received.
03
Academic Timeline
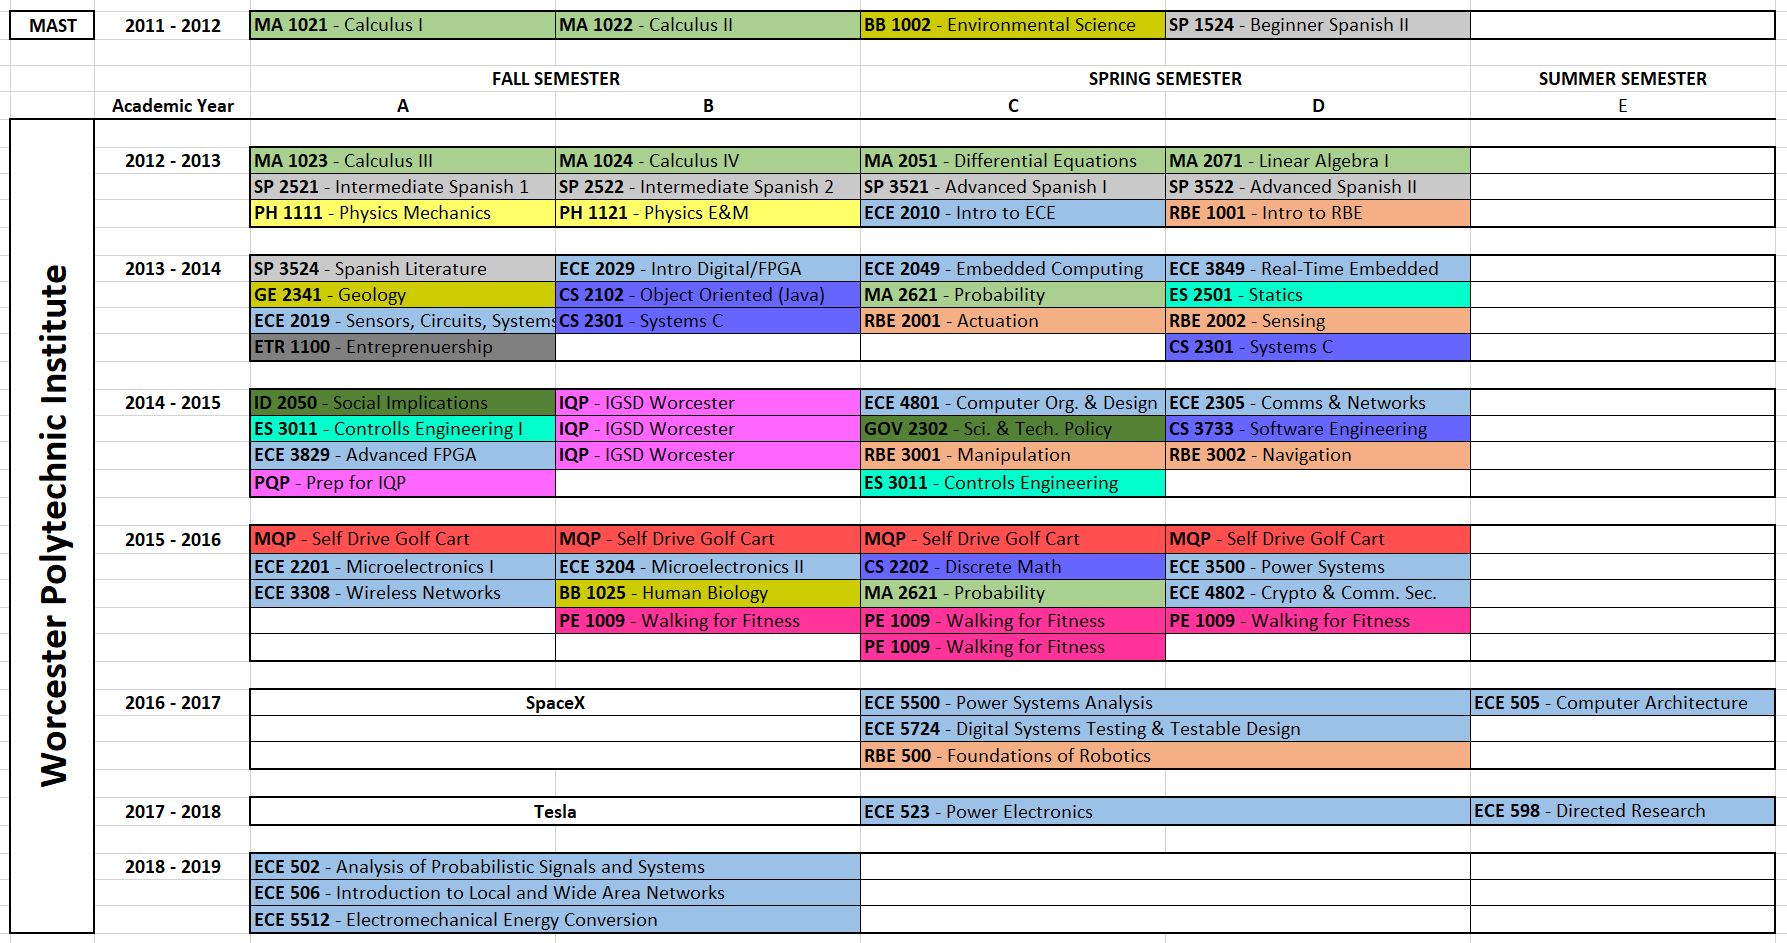
This chart shows an overall timeline from the start of my undergraduate career to completion of my Masters degree. This chart displays all of the courses I have taken organized by academic year and semester. This is important for demonstrating how sequential classes were taken and the duration of classes.
04
Undergraduate vs Graduate Coursework
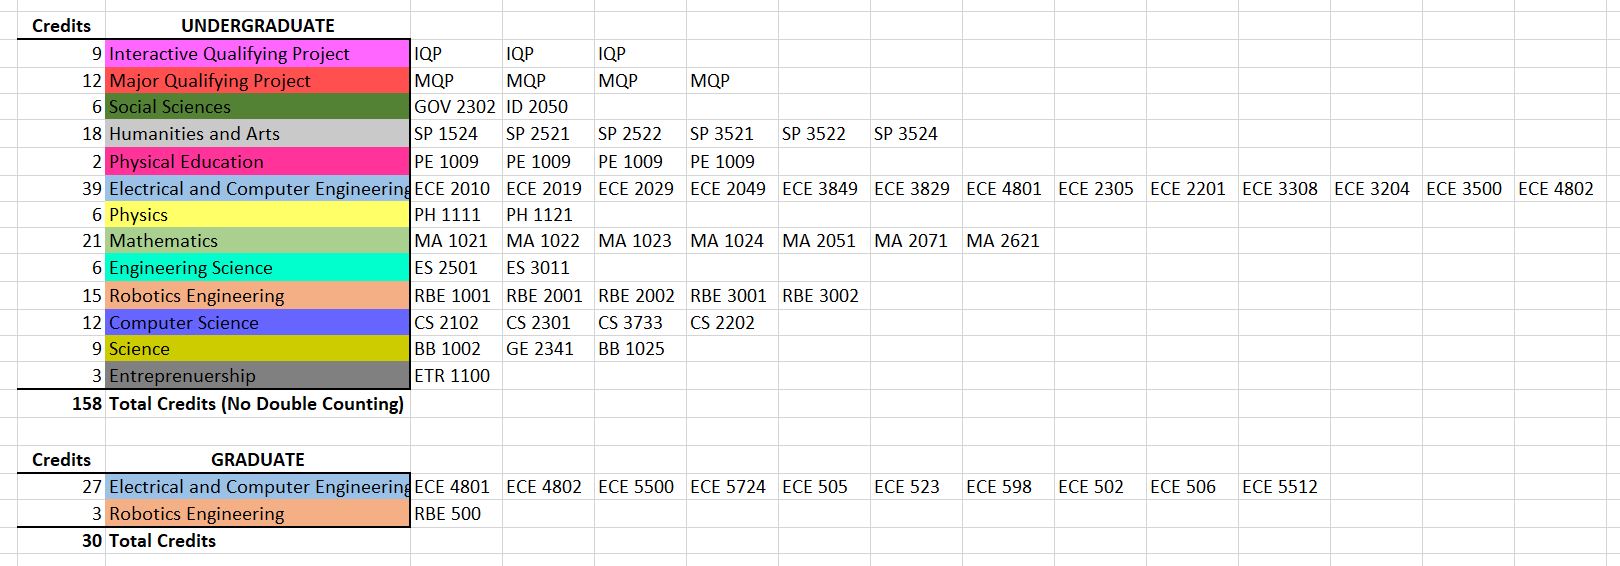
This chart shows my undergraduate and graduate course distribution by field of study.


